When we visited Laos, I couldn't help but wonder if it was so (relatively) poor due to its status as a landlocked country.
So I put together the following graphs comparing PPP Adjusted GDP per Capita (IMF or CIA number if IMF not available) for all countries that are not islands (my hypothesis is that they develop differently than continental countries-different political/environmental pressures, etc.) and at least 1,000 sq kilometer in size. I've coloured the graphs based on whether the countries are landlocked or not. I've skipped North America as there are no landlocked countries.
The results are pretty clear; on average, you're worse off economically if you're from a landlocked country.
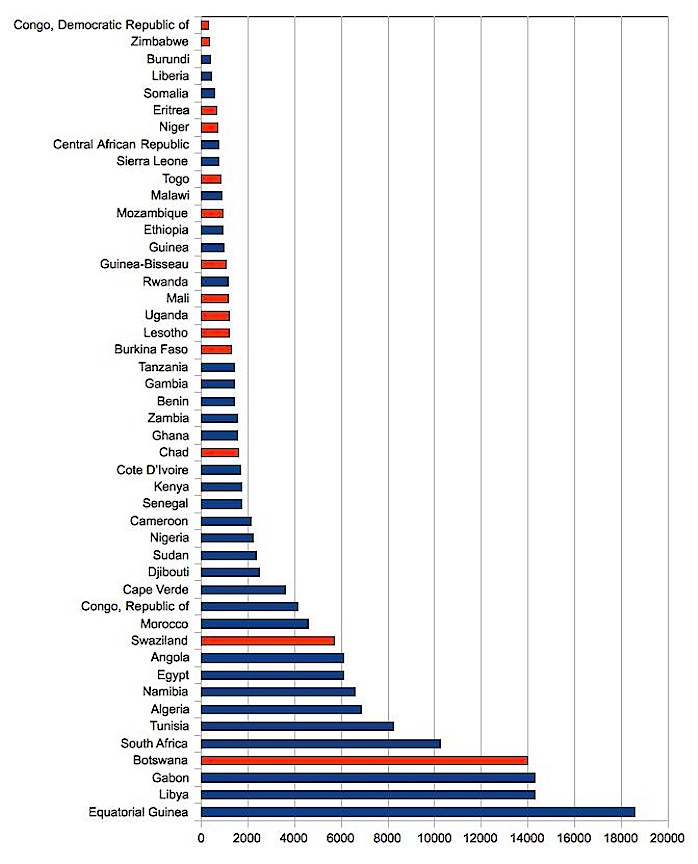
Africa
5 of the 10 poorest countries are landlocked; 11 of the poorest 20. Only 1 of the richest 10 and 2 of the richest 20 are landlocked.
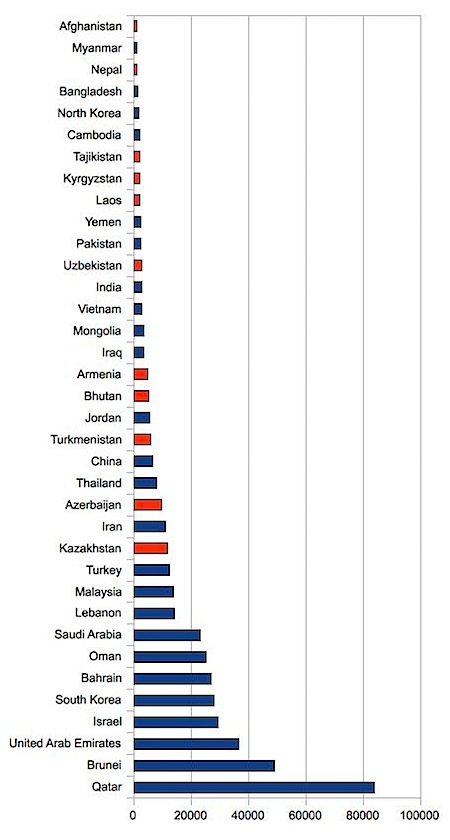
Asia & Middle East
5 of the 10 poorest and none of the 10 richest.
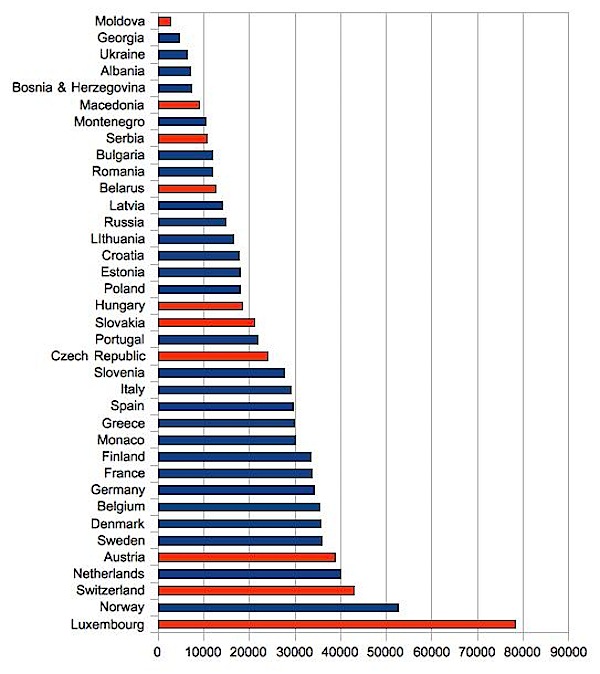
Europe
The most even of the bunch. Only 3 of the 10 poorest and 3 of the 10 richest. However, you could argue that Austria wasn't landlocked for most of its existence (due to the Holy Roman Empire) and than Luxembourg is a statistical outlier due to its small size.
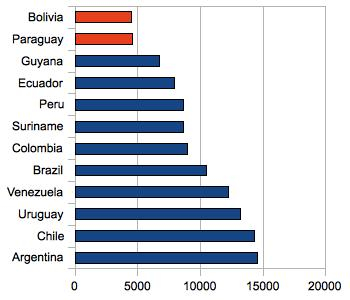
South America
It's left as an exercise to the reader to interpret the chart below.