This summer in Seattle has felt dry. Really, really, dry. Our lawns are brown and many of the flowers have given up and thrown in the towel until next year.
I wanted to understand if what I felt was actually true so I downloaded the daily history of NOAA data for SeaTac airport from January 1, 1990 to September 8, 2021 (definitions). (Thank you NOAA for making this free!) I've dropped it into a Google Sheet and there are a few interesting things to note.
First, let's take a look at the average maximum temperature for each month:
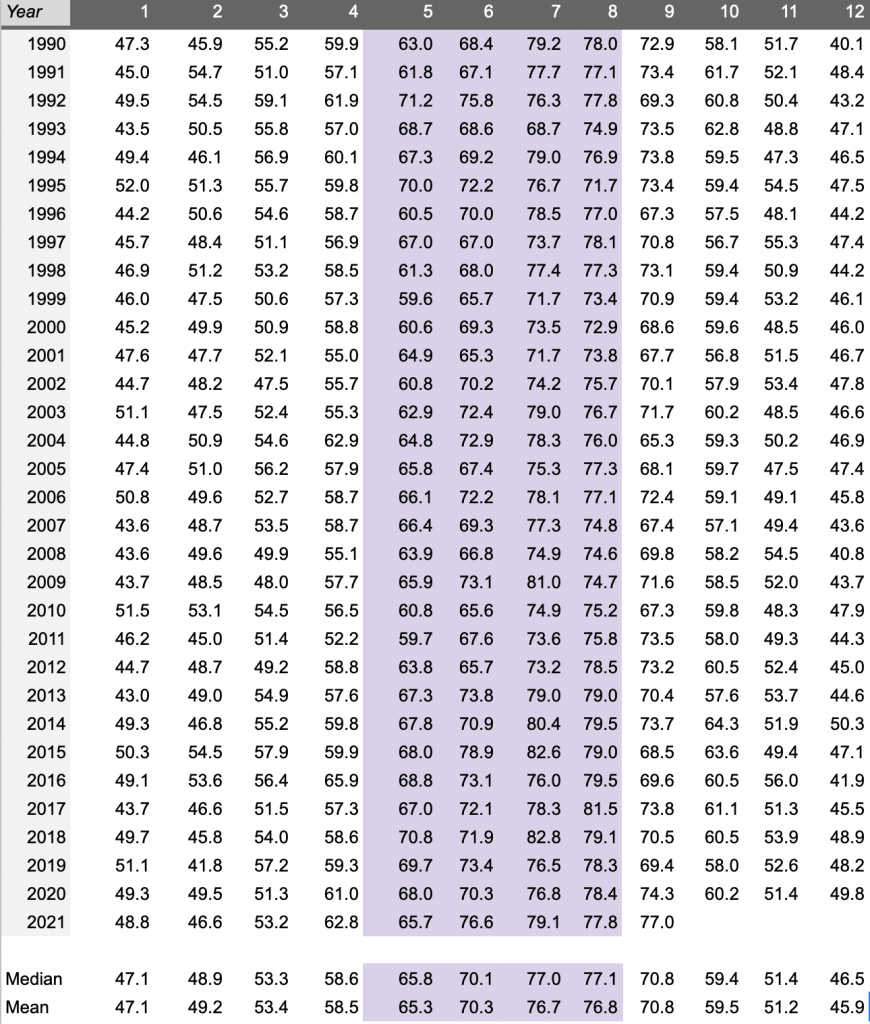
From May-August, we were above the recent historical average (barely for May) but at least one degree. But it wasn't the hottest on record and our August was actually the coolest we have had in a decade!
What about rain? The first thing we can look at is total precipitation (inches/month):
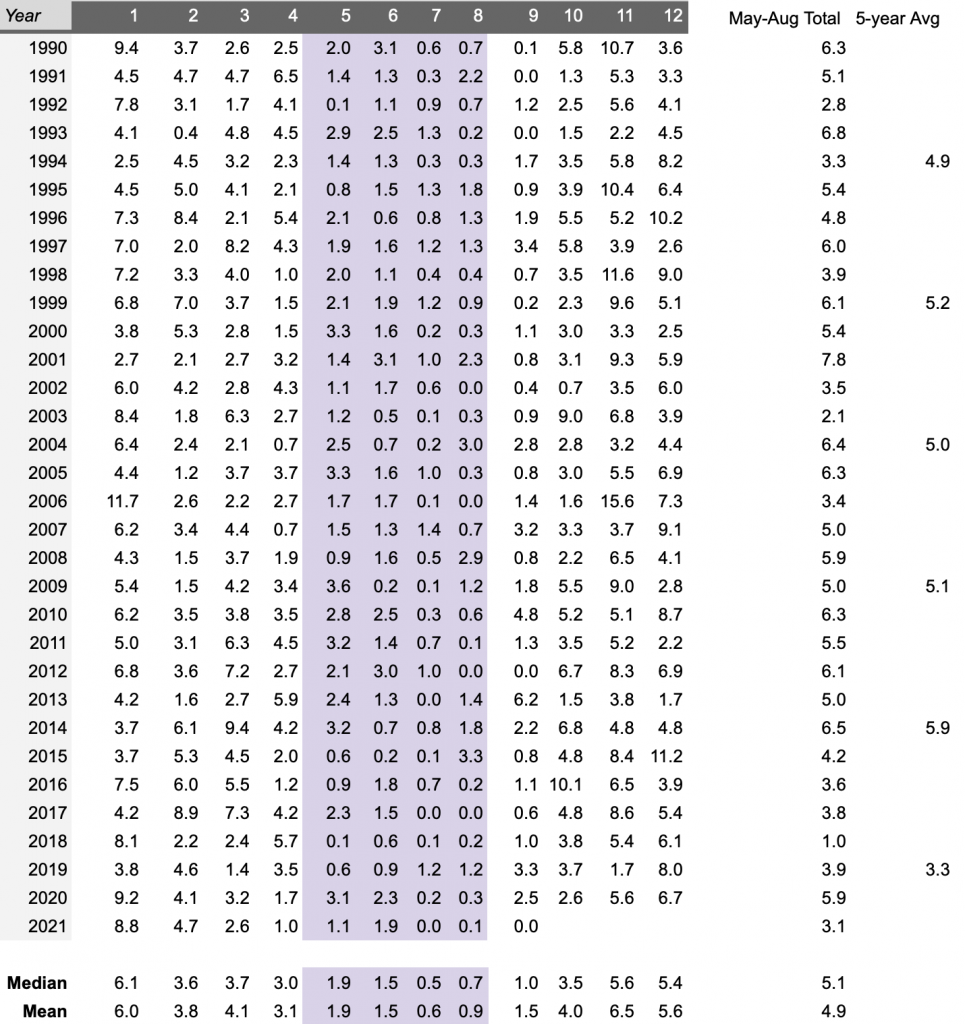
Very. Little. Rain.
Only 0.1" between July and August; the last time we had that was 2017. That year it rained ash from the sky; we've been fortunate to avoid fires and smoke so far this year.
There definitely seems to be a recent trend to less rain between May and August. We average above 5-6" per year over this time period between 1990-2015. But from 2016-2020 we dropped to ~3" by on average and this year we're back at that with 3.1"
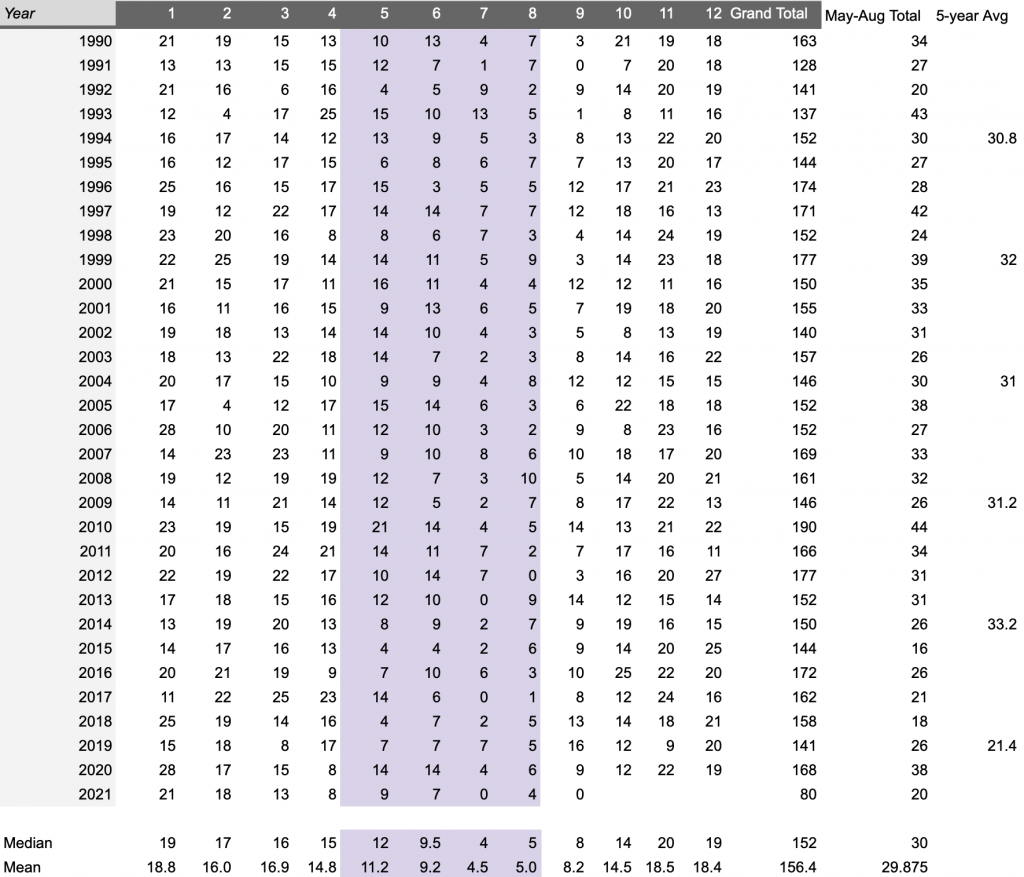
Unsurprisingly, there is a similar trend in rain days. We saw only 20 rain days over these four months and the recent 5-year average is ~21 days for this period vs. a prior average of ~30 days.
Seattle in the summer seems to be getting a little bit hotter but a lot drier.