It was a loud bang. I totally missed that pothole. I knew the road was bad here – they’re rebuilding the convention center and there’s been some subduction – but how did I miss something that big? And then they car started shouting at me. I had 13 PSI in my tire and had to… Continue reading The Moment of Truth
Category: Technology
What’s Your Favorite AI?

It sounds like a silly question: “do you have a favorite AI?” After all, they’re not like socks or a book. How do you even know when you’re dealing with one? I know what a sock looks like so I definitely know when I see one. In pairs. Hiding behind my dirty clothes. Maybe exposed… Continue reading What’s Your Favorite AI?
Art at Home
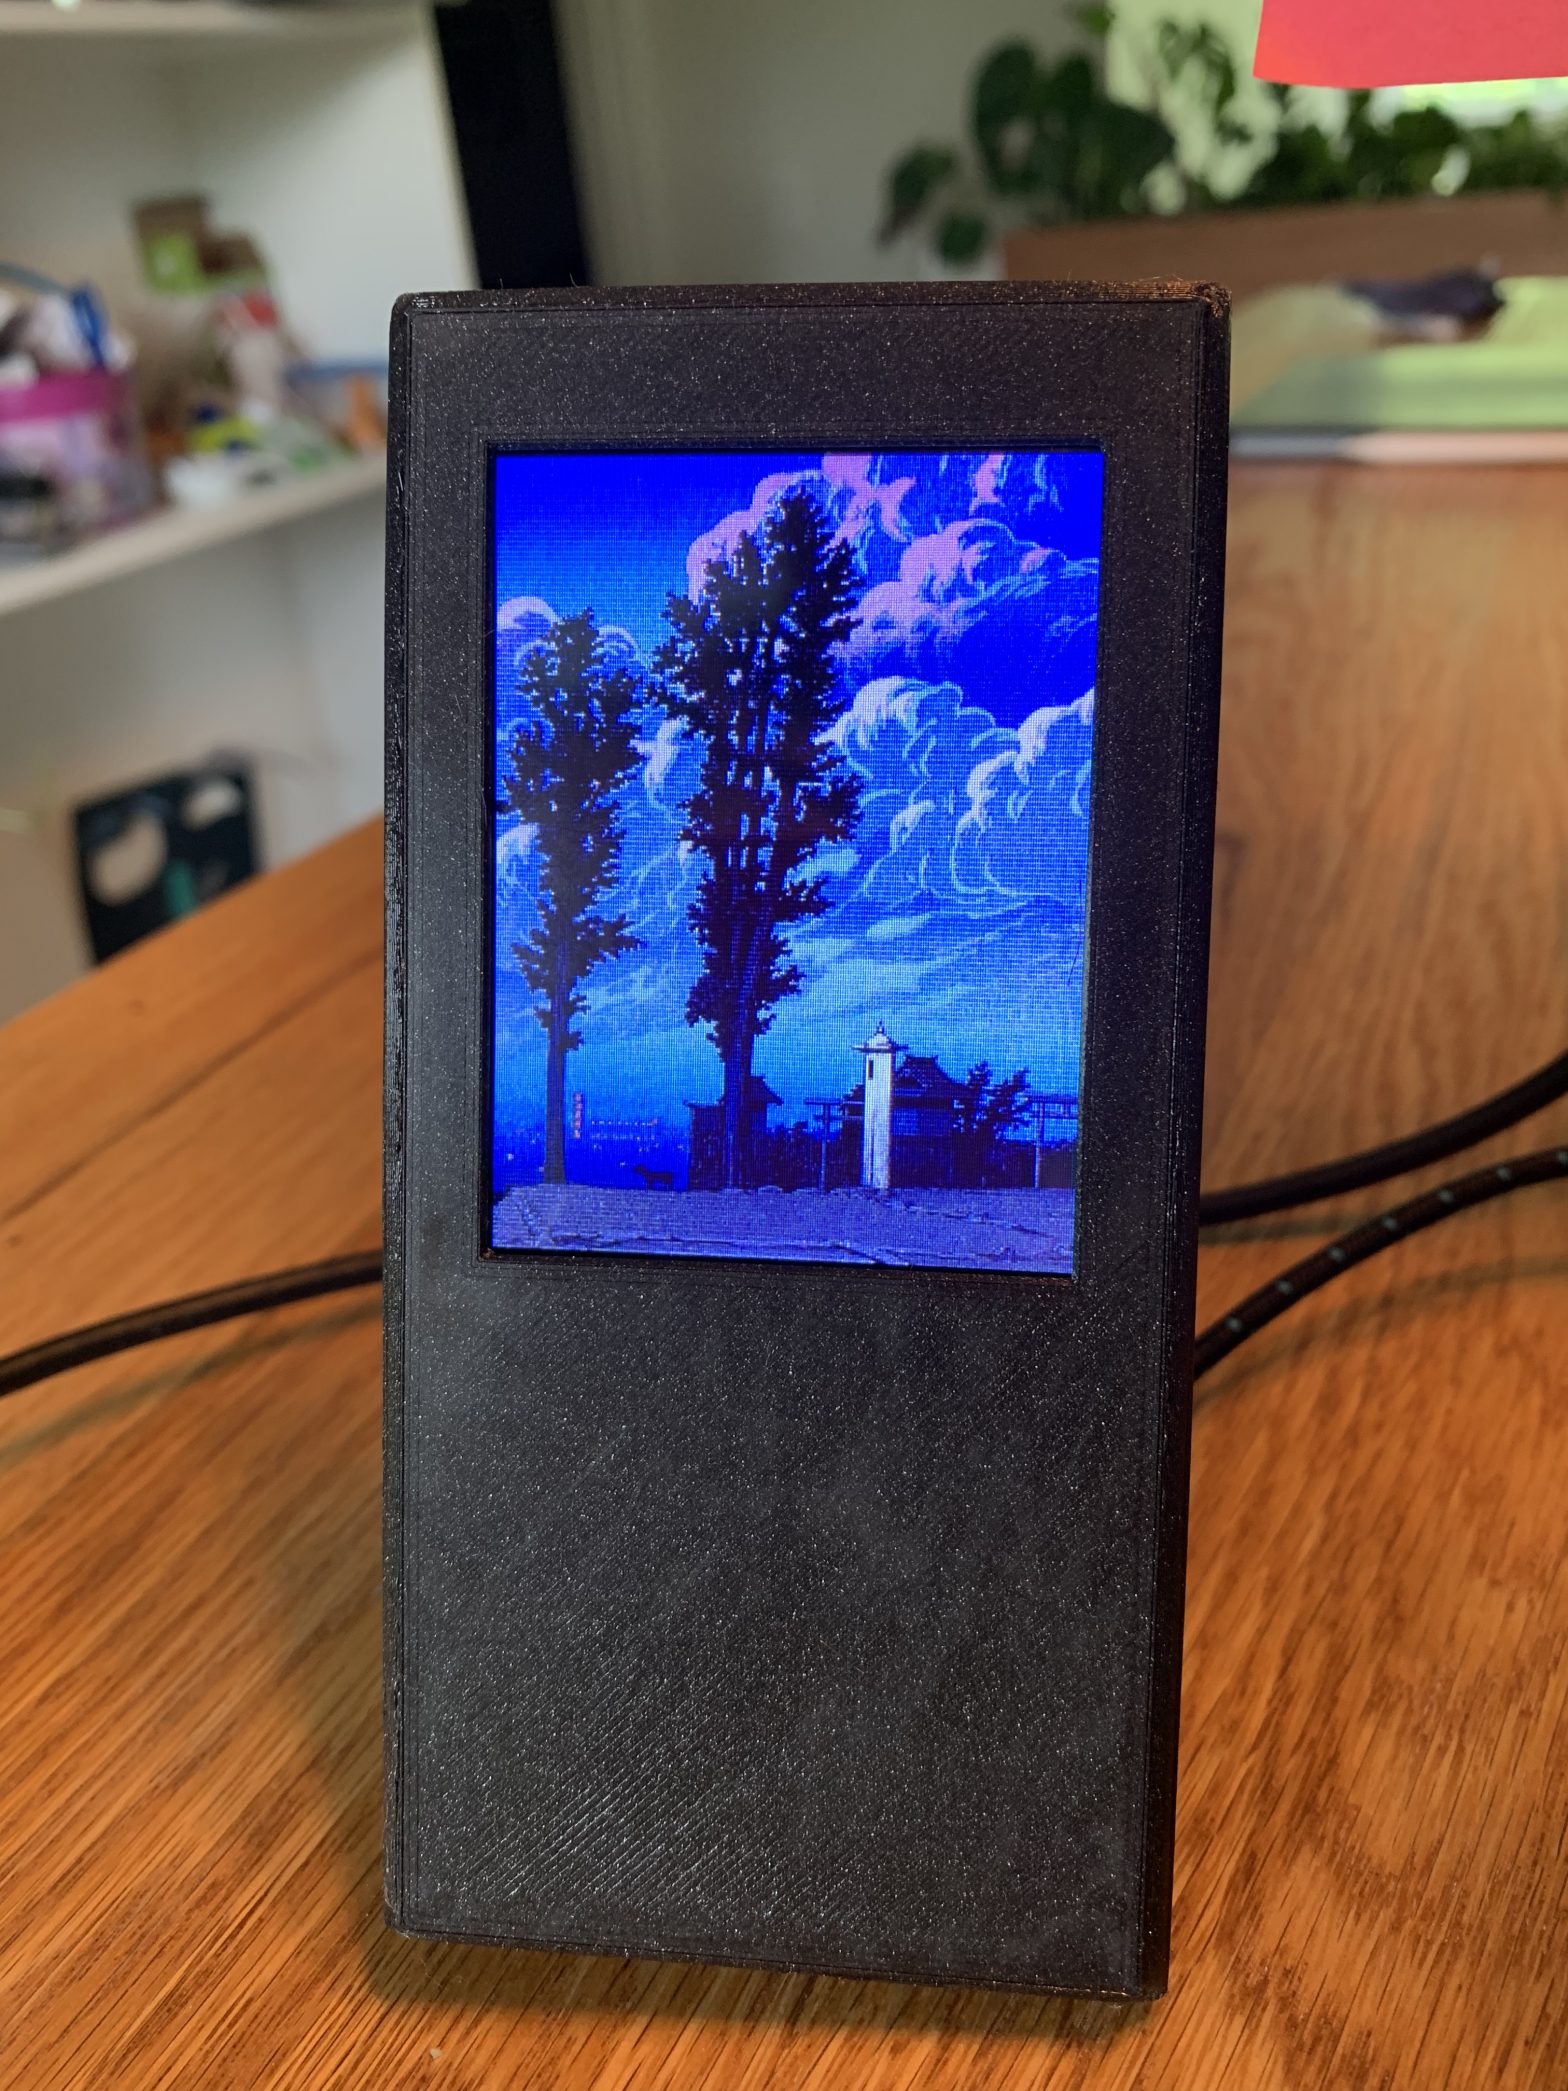
For me, one of the paradoxes of the digital age has been that the more ubiquitous things are, the less I feel like I engage in them. If feels like there’s just so much and I have so little time and attention. One example of this are my photos. As I write this, I have… Continue reading Art at Home
Plants. Without the Effort
Ilove gardening but I hate having to constantly water plants. For years, I’ve longed for vegetables that would just water themselves. As a technologist, I’ve often thought “this should be easy; just wire up a microcontroller, a pump and some sensors and make a self-watering plant system.” As a technologist, I also know that it… Continue reading Plants. Without the Effort
Finding Nearby Things in QGIS (Tutorial)
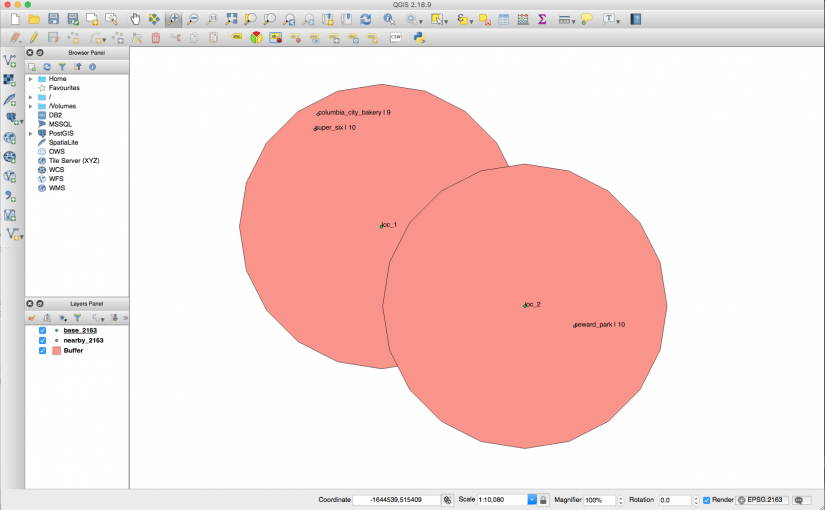
If you get excited by maps and places, here’s a reasonably common problem: I’ve got a set of locations (e.g., landmarks) I’ve got another set of locations (e.g., points of interest) and those points have additional metadata (e.g., a star rating for each place) I’d like to find all the points of interest with at… Continue reading Finding Nearby Things in QGIS (Tutorial)