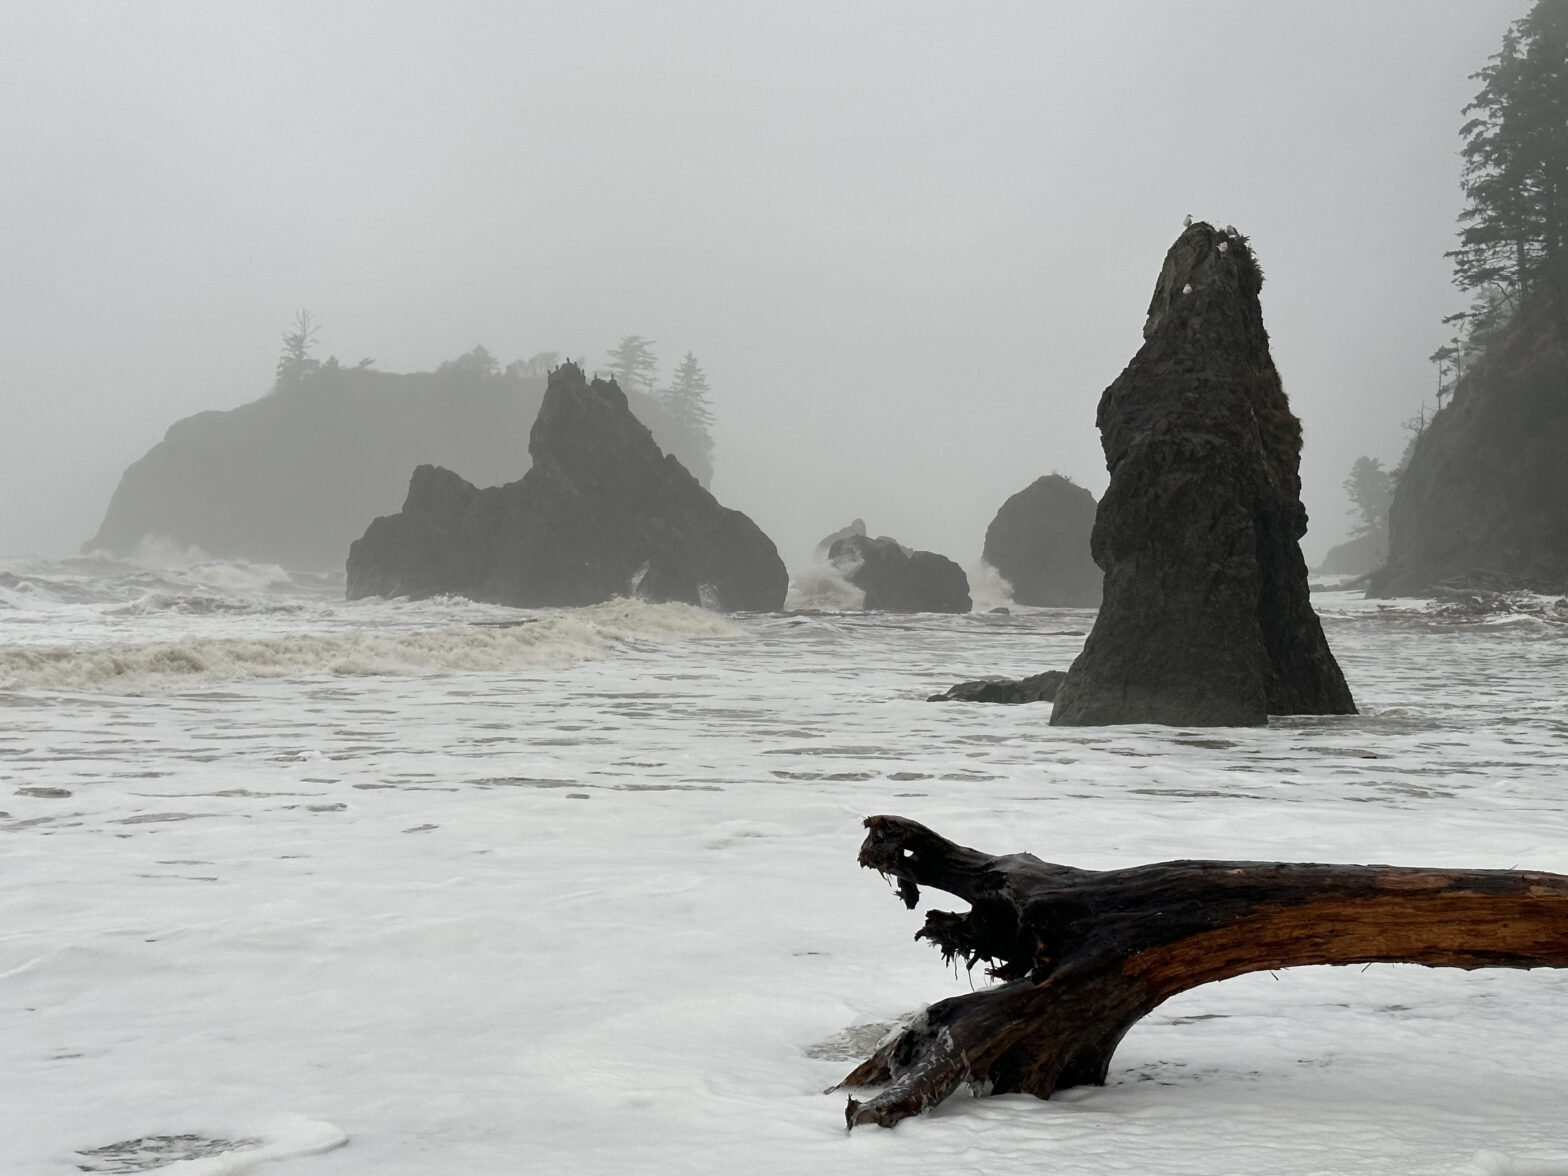
If you stay almost anywhere on the coast in Washington, it’s likely that your place may have a cryptic sign saying “Beach Logs Kill:” This is not the name of a bad band, rather a warning that 99% of the time seems unnecessary. Usually the beach logs are high above the highest tide line and… Continue reading Hunting for King Tides
A Real Case
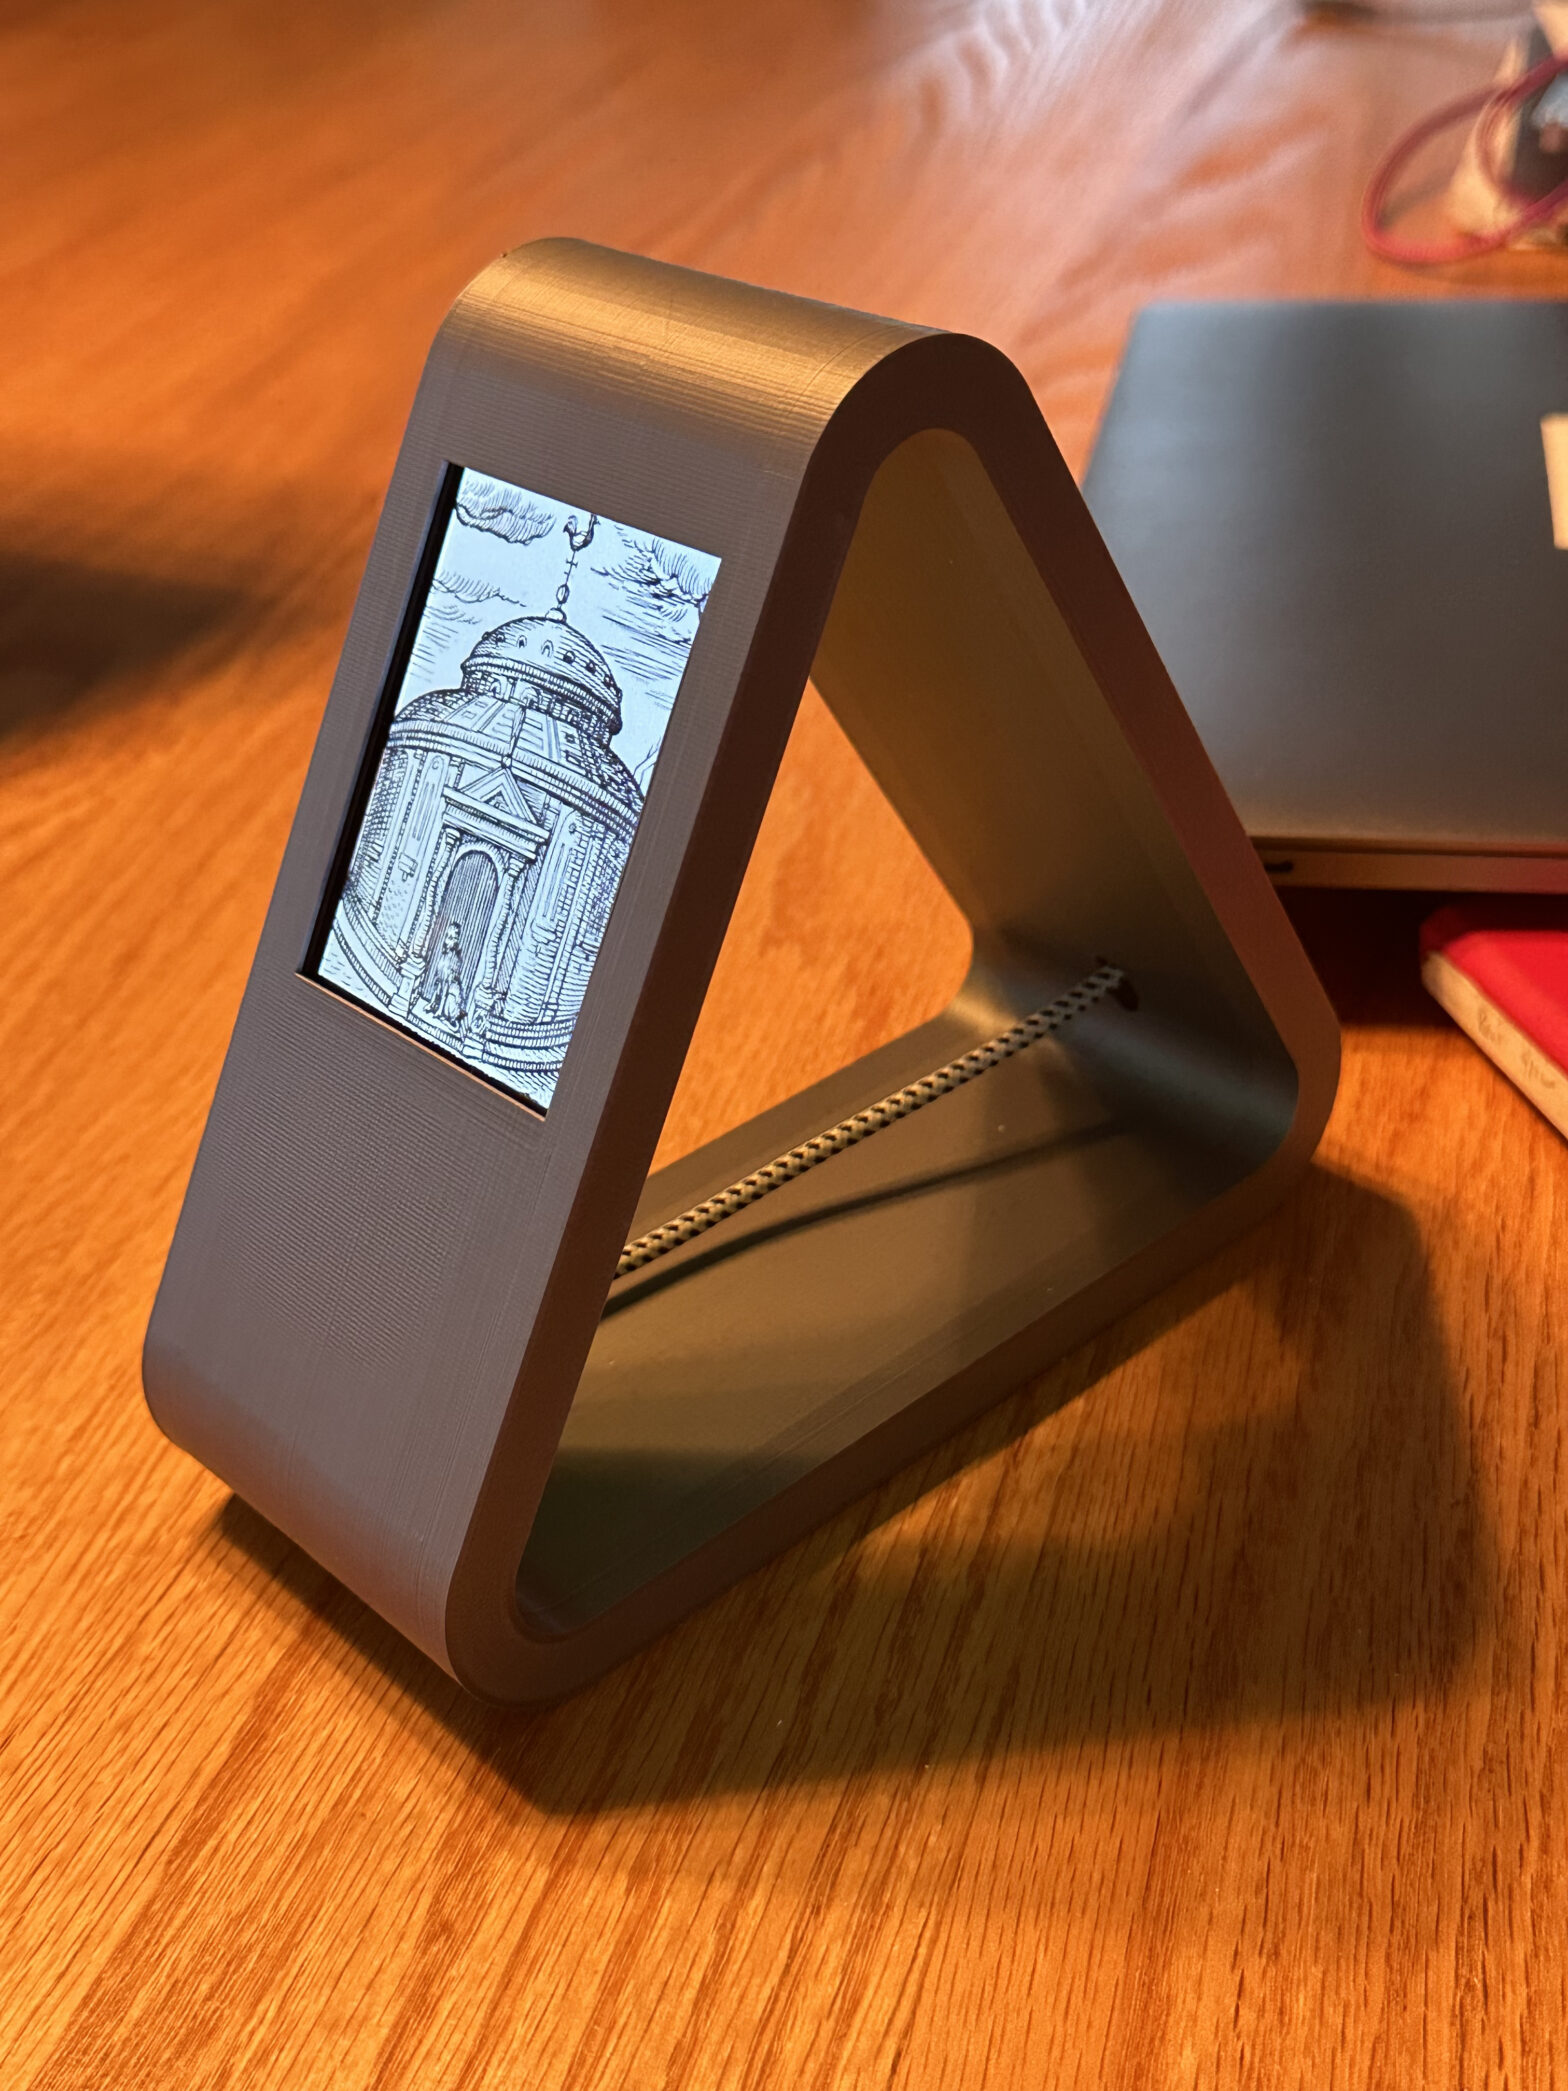
About 18 months ago I created a little display that could showcase art I found on the internet. I was happy with the ability to see art but the case I built for the display was terrible. In a matter of weeks the legs fell off and I realized I had a terrible design. Over… Continue reading A Real Case
Trip Report: Mount St. Helens
I’m going to try and do something a little different here and do some trip reports from various short adventures. Ever since I moved to Seattle I’ve been obsessed with Mt. St. Helens. Every kid has heard about how it blew up and flattened everything to the north (not actually all around it – more… Continue reading Trip Report: Mount St. Helens
Space Volcanoes
Late last night, an underwater volcano blew up off the coast of the Island of Tonga. This morning, while listening to my favorite radio show, I learned that areas just north of us were under tsunami warning. I immediately wanted to learn more. Tsunamis are terrifying for their power and fascinating in that they are… Continue reading Space Volcanoes
Summer: How Much Hotter & Drier
Seattle Summers: A little bit hotter but a lot drier